Brooklyn, NY // Independent Data & Design Studio

Kinetic Narratives
Built for Impact.

An independent New York City data and design studio turning complex public records into clear interactive stories, civic tools, and custom web applications—built for everyday New Yorkers, local businesses, and institutions alike.

Flagship Investigations • 04 Active Labs

Data Labs

Interactive visual stories exploring 125 years of NYC housing history, the $112.4 billion municipal budget, foundational hip-hop lyric taxonomies, and the 46.8% commercial lease survival cliff across 20 corridors.

01 OF 04
LAB 01 // HOUSING850K+ BUILDINGS · 1900–2026
HOUSING & URBAN HISTORY
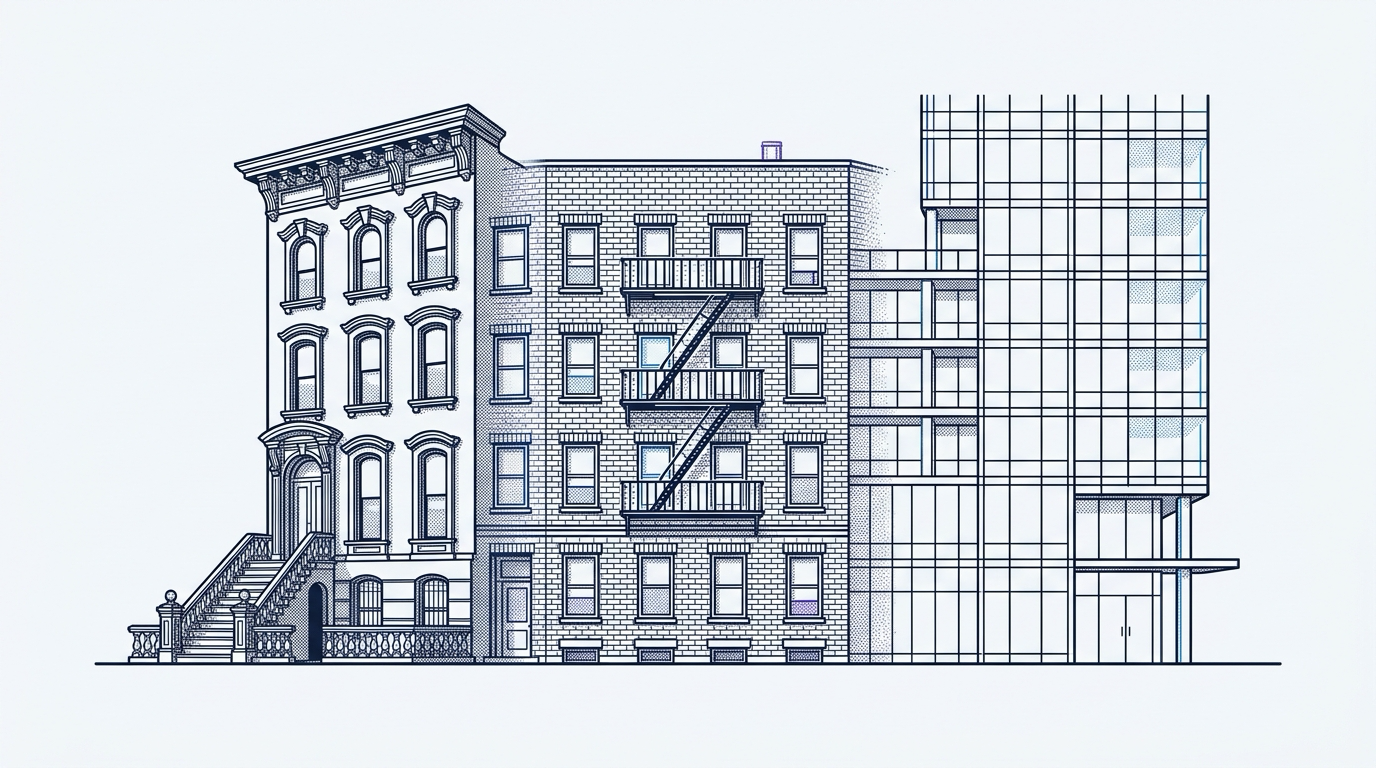
From Tenements to Towers: 125 Years of NYC Housing

From Lower East Side walk-up tenements to waterfront glass towers—an interactive 3D map charting 850,000 building footprints across all five boroughs, 125 years of zoning history, and the real affordability squeeze for everyday New Yorkers.

Buildings Mapped
850,000+ Lots
Historical Span
1900–2026

LAB 02 // PUBLIC FINANCE$112.4B BUDGET · 13 AGENCIES
FOLLOW THE MONEY · FY2026 LEDGER

The $112 Billion Receipt: NYC Budget Flow

Where do city tax dollars actually go? Follow the money across New York City's $112.4 billion FY2026 budget—from 6 revenue streams and the $100 taxpayer waffle to true pension/overtime costs and your personal itemized tax receipt.

Adopted Budget
$112.4 Billion
True-Cost View
Pensions + Overtime
LAB 03 // CULTURE25 BEDROCK BARS · 35 LINEAGES
LYRICAL TAXONOMY & NYC MUSIC HERITAGE

Lauded Lyrics: NYC Hip-Hop Taxonomy & Citation Trees

Mapping the lineage of 25 foundational New York City Golden Era bedrock bars across multi-generational citation trees, word-level diff tagging, and borough-by-borough linguistic migration.

Bedrock Bars
25 Foundation Tracks
Lineage Citations
35 Verified Trees
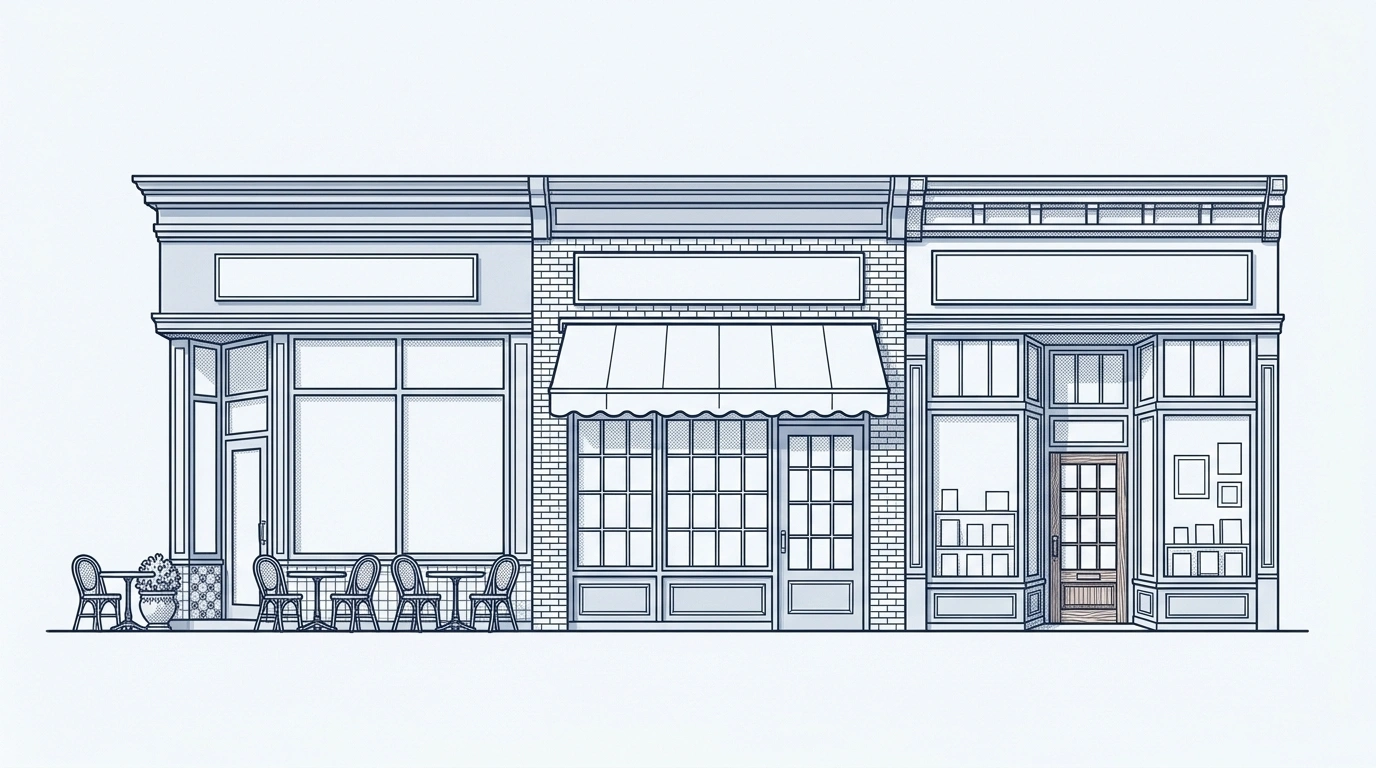
LAB 04 // COMMERCIAL URBANISM28,450 STOREFRONTS · 20 CORRIDORS
STOREFRONT CHURN & THE RENEWAL CLIFF

The Five-Year Lease: Storefront Churn & Commercial Longevity

Tracking 28,450 NYC storefront permits, the 46.8% five-year survival cliff, and real rent-to-ticket break-even math across 20 commercial corridors in all five boroughs.

Net Churn Shock
-487 Q1 / -310 Q3
5-Yr Survival Cliff
46.8%
EXPLORE ALL 4 LABS
NEIGHBORHOOD FINDER // QUICK PREVIEW

NYC Neighborhood Finder

Pick your monthly housing budget, your dream NYC neighborhood, and your #1 daily priority to see how your aspirational target stacks up against your top budget-matched alternative.

$3,500/mo
Requires ~$144k/yr income under NYC 40x rule
3. Your Top Priority
★ DREAM BENCHMARK+$100/mo over budget

Park Slope

BROOKLYN • Victorian Brownstone Rowhouses

“Victorian brownstone sanctuary flanked by Prospect Park's 585 pastoral acres.”

MEDIAN 1BR RENT
$3,600/mo
MIDTOWN COMMUTE
~25 min
SUBWAY LINES:
23BQFG
✓ TOP #1 BUDGET MATCHSaves $950/mo vs. Dream

Harlem (Central / West / East)

🚇 ~18 min to Midtown
MANHATTAN • Victorian Brownstones & Pre-War Elevator Cooperatives

Why It Wins For Your Priority:Reaches Midtown in ~18 mins via 2/3/A/B/C express lines while keeping 1BR rent at $2,650/mo.

MEDIAN 1BR RENT
$2,650/mo
MIDTOWN COMMUTE
~18 min
2.0 MAP

+ 2 More Wildcard Neighborhoods (Riverdale, Woodside) & 4 Street-Level Micro-Hotspots waiting on the map →

SUBWAY LINES:
23ABCD
NEIGHBORHOOD FINDER 2.0 // FULL MAP & MICRO-ZONES

Compare Park Slope side-by-side with Harlem, Riverdale, and Woodside—with street-level pins for express trains, dining corridors, modern buildings, and quiet blocks.

[ Explore All 4 Matches & Street Micro-Zones on the Map → ]
PARTNER WITH DIV LABS STUDIO

“Have Data, Will Build.”

We partner with civic groups, local business owners, media outlets, and corporate teams to turn messy records into interactive investigations, neighborhood market viability reports, and decision tools.